Transparency Report — Q1 2026 (Daytrader & Investor)
Our Q1 2026 transparency report, now covering both programs. The Daytrader program: 38 Leverage signals across 29 pairs, 97.4% reached entry and 81.1% hit TP1. The Investor program: 25 signals, six closed at TP2 so far, the rest still held. Every trade is listed.
At Blocksignal, one word mattered from day one: transparency. We've all seen the other side of this industry, the loud promises and the "exclusive" groups that go quiet the moment markets stop trending. We built Blocksignal to do the opposite: stay active through every market phase, and be honest about what our signals actually did and didn't do. This is where we publish that scoreboard. Every quarter we look back at the prior period and answer one plain question: did price reach the milestones we communicated?
This is our Q1 2026 review, and it covers both programs side by side, the same way you see them on our homepage: the Leverage signals from our Daytrader program, and the signals from our Investor program.
How to read a signal
A signal is never a single bet. It's a structured plan with milestones, and we track three of them. Entry hit means price reached the communicated entry zone. TP1 hit means price reached the first take-profit area, where risk is usually reduced and some profit can be realized. TP2 hit means price reached a second take-profit area, an additional objective that isn't required for a good outcome once TP1 is already in. A TP2 miss is not the same kind of miss as a TP1 miss: if TP1 is reached, the idea had its chance to pay, and TP2 is the stretch goal.
Scope and method
These numbers cover signals posted between January 1 and March 31, 2026. We verify each signal against market price data from Binance, Bybit, OKX, Bitget, and CoinGecko, and we read the Entry, TP1, and TP2 outcomes straight from our internal signal records. A "hit" means price touched the relevant zone or level. It does not mean every member executed perfectly, and it does not reflect realized profit and loss, which depends on individual entries, leverage, and stop-loss handling. This report is descriptive and meant for transparency, and it is not investment advice. All timestamps are UTC.
Leverage signals (Daytrader program)
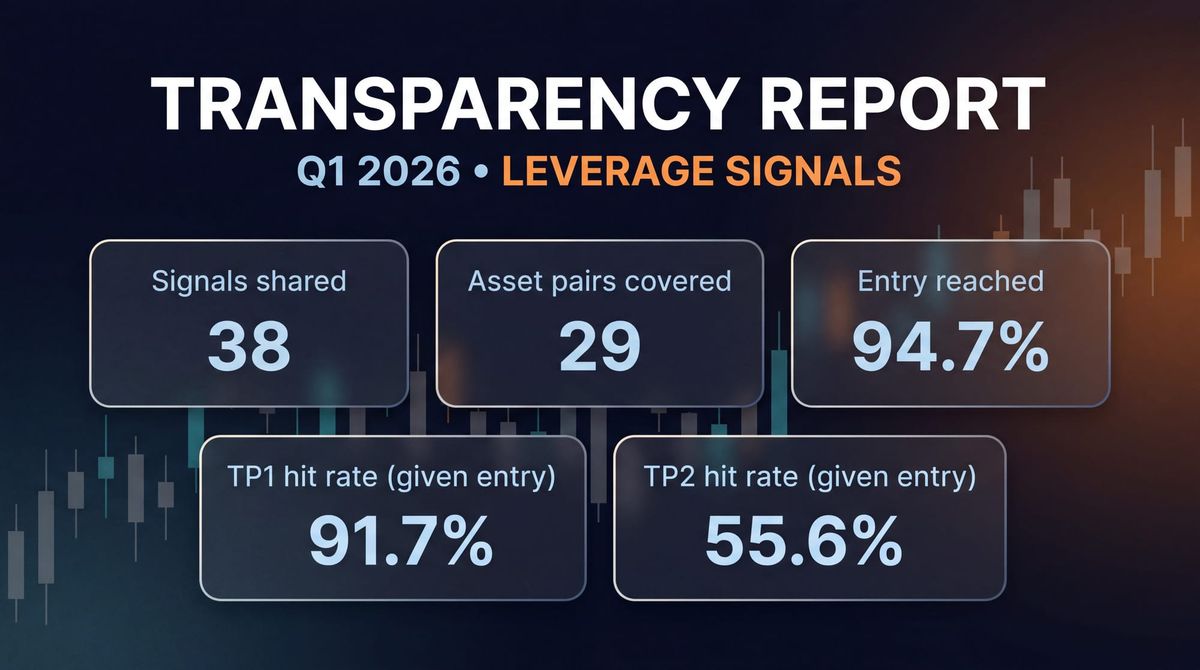
Over the quarter we published 38 leverage signals across 29 different asset pairs. Entry reliability was high: 37 of 38 signals reached their entry zone (97.4%). Of those 37 triggered signals, 30 went on to hit at least their first profit target (81.1%), and 17 ran all the way to TP2 (45.9%).
How to read the results
Two things shape the table below. First, all Leverage figures assume a 2x leverage. Second, none of these trades are reported as "still open," because a Q1 trade has resolved by now. When a triggered signal didn't reach TP1, it still closed in one of three ways under our active risk management: in profit before the target, around break-even, or stopped out at a loss. In Q1, seven triggered signals didn't reach TP1; five of those still closed in profit, one closed at break-even, and one was a stop-out loss.
We don't spell out the exact mechanics of how we protect and manage these positions here, because that approach is part of our member program, where you get the full method and the trade-by-trade detail. The point of this report is the scoreboard, and the scoreboard speaks for itself.
Leverage — all Q1 2026 signals
| # | Opened (UTC) | Pair | Dir | Entry zone | TP1 zone | TP2 zone | TP1 hit | TP2 hit | Result |
|---|---|---|---|---|---|---|---|---|---|
| 1 | 2026-01-10 15:48 | POL/USD | Short | 0.17–0.178 | 0.14 | 0.11 | 2026-01-16 | 2026-01-29 | Closed — TP2 hit |
| 2 | 2026-01-12 17:14 | LTC/USD | Long | 73–76 | 81 | 87 | — | — | Closed — TP1 not reached; in profit (max +8.6%) |
| 3 | 2026-01-13 08:09 | DASH/USD | Short | 46–47 | 42 | 37 | 2026-01-31 | 2026-02-05 | Closed — TP2 hit |
| 4 | 2026-01-14 06:11 | LINK/USD | Short | 14–14.4 | 13.46 | 12.95 | 2026-01-16 | 2026-01-19 | Closed — TP2 hit |
| 5 | 2026-01-14 17:18 | AVAX/USD | Short | 14.85–15.26 | 13.41 | 12.25 | — | — | Not entered (entry never reached) |
| 6 | 2026-01-14 17:25 | SYS/USD | Short | 0.217–0.22 | 0.192 | 0.17 | 2026-01-17 | 2026-01-17 | Closed — TP2 hit |
| 7 | 2026-01-19 06:29 | ALGO/USD | Long | 0.112–0.1175 | 0.13 | 0.14 | — | — | Closed — TP1 not reached; in profit (max +10.4%) |
| 8 | 2026-01-26 15:16 | ENA/USD | Long | 0.16–0.17 | 0.18–0.21 | 0.25–0.27 | — | — | Closed — TP1 not reached; in profit (max +6.9%) |
| 9 | 2026-02-06 07:37 | ADA/USD | Long | 0.24–0.255 | 0.3–0.35 | — | 2026-02-14 | — | Closed — TP1 hit, no TP2 |
| 10 | 2026-02-17 07:37 | HBAR/USD | Short | 0.1–0.108 | 0.073–0.09 | — | — | — | Closed — TP1 not reached; in profit (max +12.3%) |
| 11 | 2026-02-17 07:43 | MYX/USD | Short | 1.61–1.8 | 0.89–1 | 0.7–0.8 | 2026-02-18 | 2026-02-23 | Closed — TP2 hit |
| 12 | 2026-02-21 21:01 | BGB/USD | Long | 2.34–2.36 | 3.8–4.1 | 4.5–5.7 | — | — | Closed — break-even (risk management); TP1 not reached |
| 13 | 2026-02-27 07:37 | ETH/USD | Short | 2070–2146 | 1910–1965 | 1800–1850 | 2026-03-03 | — | Closed — TP1 hit, no TP2 |
| 14 | 2026-02-27 07:43 | BNB/USD | Short | 625–642 | 600–612 | 570–588 | 2026-02-27 | — | Closed — TP1 hit, no TP2 |
| 15 | 2026-03-02 15:51 | ETH/USD | Short | 2070–2150 | 1965–1980 | 1850 | 2026-03-03 | — | Closed — TP1 hit, no TP2 |
| 16 | 2026-03-02 15:53 | BTC/USD | Short | 69800–71000 | 65200–67000 | 62600–65000 | 2026-03-03 | 2026-03-29 | Closed — TP2 hit |
| 17 | 2026-03-02 15:57 | BONK/USD | Short | 0.00000635–0.00000661 | 0.00000583–0.00000593 | 0.00000514–0.00000525 | 2026-03-03 | — | Closed — TP1 hit, no TP2 |
| 18 | 2026-03-02 15:59 | BNB/USD | Short | 645–655 | 610–620 | 578–590 | 2026-03-07 | — | Closed — TP1 hit, no TP2 |
| 19 | 2026-03-02 16:01 | DASH/USD | Short | 34.8–36.3 | 30.7–31.2 | — | 2026-03-08 | — | Closed — TP1 hit, no TP2 |
| 20 | 2026-03-02 16:04 | HYPE/USD | Short | 32–34.4 | 29–29.9 | 26–27.1 | 2026-03-06 | — | Closed — TP1 hit, no TP2 |
| 21 | 2026-03-04 15:38 | ETH/USD | Short | 2140–2225 | 1920–1990 | 1800–1850 | 2026-03-06 | — | Closed — TP1 hit, no TP2 |
| 22 | 2026-03-04 15:41 | BNB/USD | Short | 660–680 | 612–635 | 575–590 | 2026-03-06 | 2026-04-02 | Closed — TP2 hit |
| 23 | 2026-03-10 03:21 | BAS/USD | Short | 0.00794–0.00815 | 0.00624–0.00685 | 0.00464–0.005382 | 2026-03-28 | 2026-04-03 | Closed — TP2 hit (recovered via risk management) |
| 24 | 2026-03-10 03:24 | FLOW/USD | Short | 0.0594–0.06 | 0.0462–0.0495 | 0.034–0.0395 | 2026-03-14 | 2026-03-16 | Closed — TP2 hit |
| 25 | 2026-03-11 12:42 | FET/USD | Short | 0.163–0.1672 | 0.151–0.153 | 0.1395–0.145 | — | — | Closed — stop-out loss |
| 26 | 2026-03-13 11:36 | BTC/USD | Short | 72200–74000 | 68000–69150 | 63000–66000 | 2026-03-19 | 2026-03-27 | Closed — TP2 hit |
| 27 | 2026-03-13 11:40 | ALGO/USD | Short | 0.093–0.095 | 0.084–0.086 | 0.08–0.081 | 2026-03-22 | 2026-03-27 | Closed — TP2 hit |
| 28 | 2026-03-13 11:46 | ENA/USD | Short | 0.1156–0.12 | 0.102–0.107 | 0.094–0.096 | 2026-03-14 | 2026-03-22 | Closed — TP2 hit |
| 29 | 2026-03-13 11:49 | NEIRO/USD | Short | 0.0000745–0.000076 | 0.000066–0.000068 | 0.0000605–0.000062 | 2026-03-18 | 2026-03-22 | Closed — TP2 hit |
| 30 | 2026-03-13 11:54 | RENDER/USD | Short | 1.82–2 | 1.59–1.62 | 1.3–1.43 | 2026-03-22 | — | Closed — TP1 hit, no TP2 |
| 31 | 2026-03-16 14:40 | CFX/USD | Short | 0.066–0.069 | 0.058–0.06 | 0.054–0.055 | 2026-03-18 | 2026-03-29 | Closed — TP2 hit |
| 32 | 2026-03-19 09:17 | AKT/USD | Short | 0.532–0.568 | 0.48–0.4965 | 0.41–0.433 | 2026-03-27 | 2026-04-06 | Closed — TP2 hit |
| 33 | 2026-03-19 13:39 | KAS/USD | Short | 0.039–0.041 | 0.035–0.036 | 0.029–0.031 | 2026-03-20 | 2026-04-01 | Closed — TP2 hit |
| 34 | 2026-03-19 13:57 | QNT/USD | Short | 76–82 | 67–69 | 60–65 | 2026-03-23 | — | Closed — TP1 hit, no TP2 |
| 35 | 2026-03-25 12:10 | FET/USD | Short | 0.26–0.28 | 0.2–0.22 | 0.15–0.17 | 2026-04-18 | — | Closed — TP1 hit, no TP2 |
| 36 | 2026-03-25 12:19 | XLM/USD | Short | 0.175–0.182 | 0.163–0.165 | 0.147–0.157 | 2026-03-28 | 2026-04-06 | Closed — TP2 hit |
| 37 | 2026-03-26 09:26 | TRX/USD | Short | 0.317–0.325 | 0.2977–0.305 | 0.2785–0.29 | — | — | Closed — TP1 not reached; in profit (max +4.2%) |
| 38 | 2026-03-31 10:36 | DOT/USD | Long | 1.22–1.24 | 1.3–1.4 | 1.43–1.66 | 2026-04-01 | — | Closed — TP1 hit, no TP2 |
Risk management in action
A handful of these trades didn't reach TP1 but were still closed in profit or at break-even, and two moved deep against the position before resolving: one was brought back to a profitable close, and the other was stopped out at a loss. That outcome spread is the risk management doing its job, in good setups and bad. How we actually run and protect these positions is part of the Daytrader member program. If you want the method behind the numbers, that's where it lives.
Follow the Daytrader signals as they happen. Our free Discord runs daily market briefings and an open look at how the program is performing, with no commitment to start. Join the free Discord →
Investor program
The Investor program is a long-term program, and that changes how you should read it. These are positions meant to be held through volatility, and they can stay open well beyond a single quarter. So the profitability of the Investor program cannot be judged on a short, few-week window. A position that's still open today isn't a result yet; it's a position in progress.
Over Q1 we published 25 Investor signals across 19 asset pairs. Entry reliability was high: 22 of 24 triggerable signals reached their entry zone (91.7%). Two signals never triggered (entry not reached) and one was invalidated by a later update before it could trigger. Of the 22 that triggered, six have fully closed at their second target so far; the other 16 are still open and held under the long-term strategy, and three of those have already reached TP1 while they continue to hold.
We split the signals into closed positions and open positions below. For the open positions we deliberately don't show the target zones, because those targets are still active.
Investor — closed positions (Q1 2026)
| # | Opened (UTC) | Pair | Dir | Entry zone | TP1 zone | TP2 zone | TP1 hit | TP2 hit | Result |
|---|---|---|---|---|---|---|---|---|---|
| 1 | 2026-03-11 13:03 | TURBO/USD | Long | 0.00088–0.00091 | 0.001–0.00104 | 0.0012–0.00129 | 2026-03-12 | 2026-03-12 | Closed — TP2 hit |
| 2 | 2026-03-12 15:27 | FIL/USD | Long | 0.77–0.86 | 0.93–0.98 | 1–1.11 | 2026-03-16 | 2026-03-16 | Closed — TP2 hit |
| 3 | 2026-03-19 09:26 | EGLD/USD | Long | 4–4.07 | 4.39–4.48 | 4.57–4.71 | 2026-04-17 | 2026-04-17 | Closed — TP2 hit |
| 4 | 2026-03-19 13:34 | FLUX/USD | Long | 0.0515–0.052 | 0.057–0.059 | 0.062–0.063 | 2026-04-01 | 2026-04-16 | Closed — TP2 hit |
| 5 | 2026-03-26 08:56 | ATOM/USD | Long | 1.7–1.72 | 1.8–1.84 | 1.925–2.1 | 2026-04-07 | 2026-04-24 | Closed — TP2 hit |
| 6 | 2026-03-26 09:06 | NEIRO/USD | Long | 0.000059–0.00005927 | 0.0000615–0.000067 | 0.000068–0.000078 | 2026-04-13 | 2026-04-13 | Closed — TP2 hit |
Investor — open positions (Q1 2026)
Target zones are intentionally omitted because these positions are still active. MFE and MAE show how far each has moved in our favor and against us so far.
| # | Opened (UTC) | Pair | Dir | Entry zone | Status | MFE (best) | MAE (worst) |
|---|---|---|---|---|---|---|---|
| 1 | 2026-01-19 06:19 | DOT/USD | Long | 1.65–2 | Holding | +13.1% | 39.7% |
| 2 | 2026-01-19 06:27 | ADA/USD | Long | 0.34–0.36 | Holding | +6.8% | 37.0% |
| 3 | 2026-01-26 15:13 | CRV/USD | Long | 0.34–0.36 | Holding | +2.3% | 42.0% |
| 4 | 2026-01-26 15:14 | ENA/USD | Long | 0.16–0.17 | Holding | +6.9% | 43.0% |
| 5 | 2026-01-26 15:21 | MBOX/USD | Long | 0.0275–0.029 | Holding | +1.6% | 36.6% |
| 6 | 2026-01-31 17:03 | ADA/USD | Long | 0.26–0.29 | Holding | +14.0% | 19.8% |
| 7 | 2026-02-06 07:01 | DOT/USD | Long | 1.15–1.3 | Holding | +43.0% | 0% |
| 8 | 2026-02-06 07:28 | ADA/USD | Long | 0.22–0.26 | Holding | +30.7% | 0% |
| 9 | 2026-02-06 07:30 | LINK/USD | Long | 7.18–8.2 | Holding | +25.4% | 0% |
| 10 | 2026-02-17 07:40 | MYX/USD | Long | 1.54–1.65 | Holding | +8.7% | 82.0% |
| 11 | 2026-02-21 21:03 | BGB/USD | Long | 2.34–2.36 | Holding | 0% | 16.9% |
| 12 | 2026-03-09 14:08 | ADA/USD | Long | 0.25–0.26 | Holding | +15.9% | 8.7% |
| 13 | 2026-03-10 03:36 | MYX/USD | Long | 0.29–0.33 | TP1 reached, holding | +59.9% | 37.8% |
| 14 | 2026-03-11 12:54 | SEI/USD | Long | 0.061–0.063 | TP1 reached, holding | +13.4% | 21.9% |
| 15 | 2026-03-18 17:36 | CELO/USD | Long | 0.0715–0.0723 | TP1 reached, holding | +29.3% | 0% |
| 16 | 2026-03-31 10:40 | DOT/USD | Long | 1.22–1.24 | Holding | +10.7% | 6.7% |
Prefer to hold for the long run? The Investor side runs in the same free Discord, alongside our daily briefings and ongoing performance updates. Join free and see how it works before you decide. Join the free Discord →
Closing
Transparency isn't about claiming perfection. It's about publishing the scoreboard, quarter after quarter, and explaining what it means in plain language. Q1 2026 shows strong entry reliability across both programs, a solid first-objective hit rate on Leverage, and an Investor book that's behaving the way a long-term strategy should. We'll keep refining how we label hits and handle invalidations, and we'll keep sharing these reviews so you can track reality instead of vibes.
Past performance is not indicative of future results. All percentages reflect historical signal outcomes during the stated period and do not constitute investment advice. Performance is measured as price action against our signal zones using exchange market data, not realized profit and loss, which depends on individual execution and stop-loss handling. Cryptocurrency trading involves substantial risk of loss.